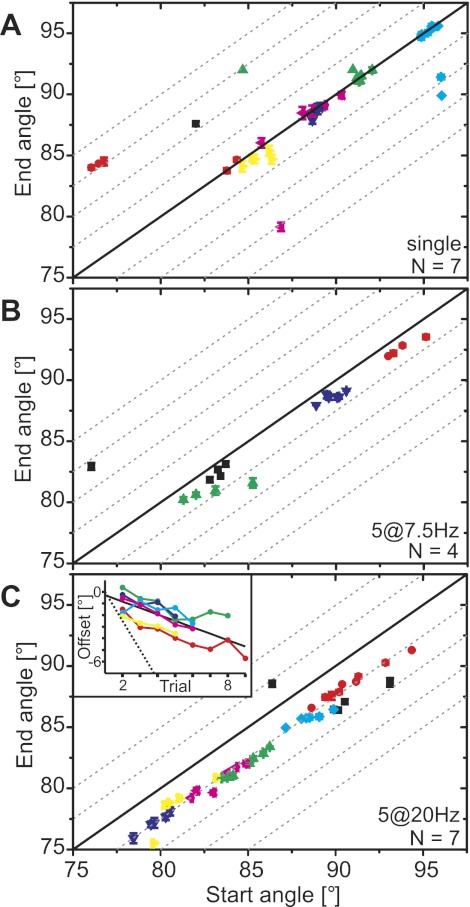
Fig. 2.
Resting angle (start angle) prior to an active movement generated by stimulation of the fast extensor tibiae motor neuron (FETi) predicts reliably the resting angle reached 10 s after the movement (end angle). A: the end angle was equal to the start angle for single twitches. Data from N = 7 different animals are shown in different colors. Symbols show means ± SD of single trials; the angles were averaged over 5 frames. In most cases the SD is smaller than the symbol size. Dashed gray lines indicate offsets in steps of 2.5° from the solid black line, which indicates end angle = start angle. Trials in A: 42, n = 5–10. There are 16 partially overlaid data points falling between starting angles of 88° and 90°, including 4 from 1 animal (black). B: the end angle depended directly on the start angle and had an offset of approximately −1° after movements generated by stimulation at 7.5 Hz. Trials in B: 19, n = 4–5. C: the end angle depended directly on the start angle and had an offset of approximately −2.5° after movements generated by stimulation at 20 Hz. Trials in C: 44, n = 5–9. Inset: repeated stimulation of FETi shifts the resting angle to more extended angles. The start angle of the first trial was subtracted from all trials such that the data indicate the offset of the start angle with respect to the first trial. The trial number had a significant effect on the resting angle (solid black line: Y = −0.55X − 0.29, R = −0.783, P < 0.001). The linear fit was applied to all individual trials of all animals. The dotted black line follows Y = −2.5 × (trial − 1) and thus gives the relation expected if the end angle of one trial was the start angle of the following trial. The data set shown in black in C was excluded from the inset because the first trial was an outlier.

