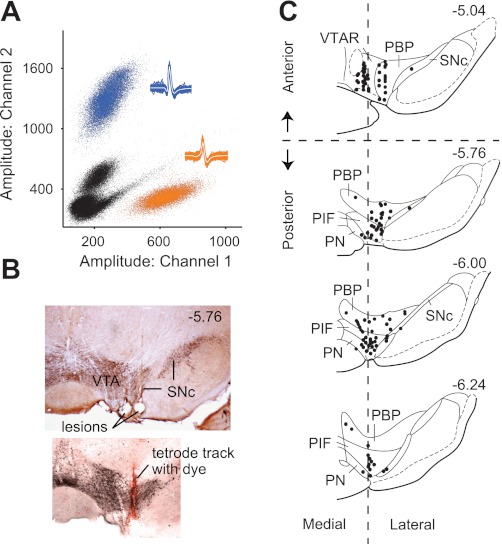
Fig. 1.
Anatomical locations of tetrodes for in vivo unit recordings from rat ventral tegmental area (VTA). A: isolation of single-unit activity was achieved by comparing the relative signal (e.g., spike amplitude) recorded on each tetrode channel. Only units that were well separated from the background noise (black dots) and separated from other clusters were accepted for analysis. Insets show the spike waveforms that correspond to the clusters of identified units (blue, orange). B: tetrode placements were confirmed by electrolytic lesions and fluorescent dyes in VTA regions stained positively for tyrosine hydroxylase. The lesions represent the last position of the tetrode as it is moved downward (ventrally) after successive days of recording. SNc: substantia nigra pars compacta. C: recordings were dispersed throughout the VTA with a majority in the parabrachial pigmented nucleus (PBP) and the paraintrafascicular nucleus (PIF). Each black circle may represent more than 1 recorded neuron. For certain post hoc analyses, the VTA was subdivided into anterior and posterior regions and medial and lateral regions based on coordinates estimated from previous studies (Ikemoto 2007). Numerals denote the position (in mm) relative to bregma. PN, paranigral nucleus; VTAR, rostral VTA. Diagram is based on illustrations in Paxinos and Watson (2007).

