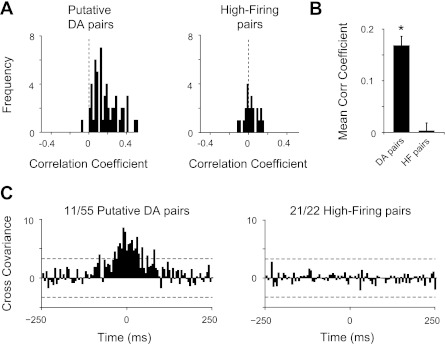
Fig. 10.
Frequency distribution histograms of correlation coefficients for pairs of neurons recorded at the same time (i.e., obtained from a single recording session). Neuron pairs were recorded simultaneously either on the same tetrode or on different tetrodes. A: correlation coefficients for pairs of putative DA neurons (n = 55) were skewed to right of the frequency plot, indicating a tendency for cross-correlated firing activity among these neurons. Correlation coefficients for pairs of high-firing/short-duration neurons (n = 22) were distributed normally at approximately zero (dotted black line). B: mean ± SE of correlation coefficients for each type of neuron pair. *P < 0.01, significantly different from mean correlation coefficient of high-firing neurons (2-tailed t-test). C: cross-correlograms for pairs of putative DA neurons and pairs of high-firing neurons: 20% of putative DA neurons showed significant cross-covariance above a 99.95% confidence interval (dotted black lines). High-firing neuron pairs did not show significant positive interactions.

