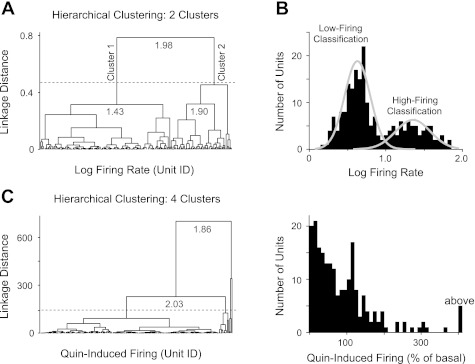
Fig. 3.
Unsupervised hierarchical clustering was applied to different neural parameters shown in Fig. 2. A: hierarchical clustering of the log-transformed basal firing rates. The resulting dendrogram shows the linkage distance between groups of data points. Data were grouped into 2 clusters based on the largest inconsistency coefficients (gray numerals) for the top 4 links in the hierarchical tree. B: analysis produced 2 disparate clusters demarcated at 10-Hz firing rate (1.0 on log scale) and represented by the double Gaussian function. These clusters were labeled as low-firing and high-firing classifications for subsequent analyses. C: alternatively, hierarchical clustering of other parameters, such as the Quin-induced firing rates, resulted in multiple clusters of data (indicated by dotted line). To maintain a conservative classification scheme, neural parameters defined by multiple clusters were avoided at this step of the analysis.

