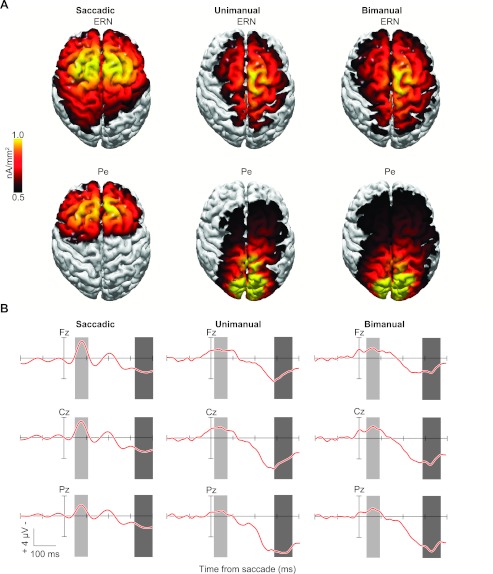
Fig. 4.
Distributed current densities across the cortical surface of the ERN and Pe from experiments 1–3. A: distributed source model of the ERN and Pe elicited by saccadic, unimanual (simple RT), and bimanual (2AFC RT) responses in the same stop-signal task. The model was computed based on errant noncanceled minus correct no-stop grand average difference waves. Time windows ±30 ms wide (ERN) and ±40 ms wide (Pe) were centered on the peak amplitude of the difference wave of the midline electrode showing maximal activity (as in Godlove et al. 2011). B: grand average difference waves with ERN (light gray shading) and Pe (dark gray shading) time periods of peak activity for each experiment at midline scalp electrodes (Fz, Cz, Pz).

