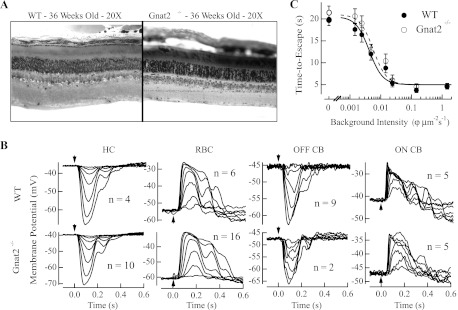
Fig. 2.
Morphological characteristics, response properties of retinal cells, and behavioral threshold of Gnat2−/− mice. A: comparison of retinal morphology in wild-type (WT) and Gnat2−/− retinas. Epoxy resin sections (Chen et al. 2006) from 36-wk-old WT and Gnat2−/− retinas reveal no loss in retinal thickness or rod outer segment length. B: comparison of response properties in horizontal cells (HC), rod bipolar cells (RBC), OFF cone bipolar cells (OFF CB), and ON cone bipolar cells (ON CB) from dark-adapted WT and Gnat2−/− retinas. Representative flash families in current clamp were collected after the delivery of a 10-ms flash of light (arrowhead). Derived response characteristics are shown in Table 1, including the response threshold (see materials and methods), resting membrane potential, and time-to-peak of the dim flash responses for the number of cells shown next to the respective responses. We found no statistical difference in the response characteristics of any of these classes of cells between WT and Gnat2−/− mice. C: behavioral threshold was estimated in WT and Gnat2−/− mice based on their ability to escape from a water maze task (Okawa et al. 2010; Sampath et al. 2005). Briefly, mice were trained in room light to escape from a 6-walled water maze task, and we characterized the time they required to exit the maze as background light levels were progressively lowered to darkness. Behavioral data are plotted as time to find the escape platform vs. background light intensity. Data reflect the behavioral performance of 4 WT and 4 Gnat2−/− mice, both bred into a C57BL/6 background. Each data point reflects the average of trials collected from 4 mice over 3 days with 3 trials/day (i.e., 36 samples). Data at every background light intensity are plotted as means ± SE. Behavioral data were fit with a Hill equation whose inflection points were 0.0048 and 0.0053 φ·μm−2·s−1 for WT (solid line) and Gnat2−/− (dashed line) mice, respectively. These data indicate that behavioral thresholds in Gnat2−/− and WT mice were similar and occurred at light levels that rely on single-photon responses traversing the retinal circuitry.

