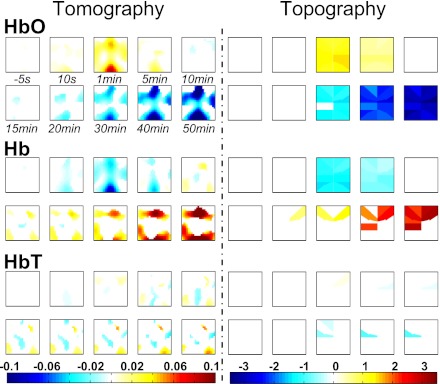
Fig. 2.
Comparisons between tomography (left; at a depth of 5 mm below the optode-array) and topography (right). On each panel, there are 3 rows: top (oxyhemoglobin concentration [HbO]), middle (deoxyhemoglobin concentration [Hb]), and bottom (total hemoglobin concentration [HbT]), each of which has 10 images at selected time points. The intensity of hemodynamic response is color-coded only if it reached a statistically significant level: red indicates a significant increase; blue a decrease; white nonsignificance (n = 6). Color map was generated in a linear manner as a function of the intensity of change. Image orientations: right, ipsilateral side; left, contralateral; top, rostral; bottom, caudal.

