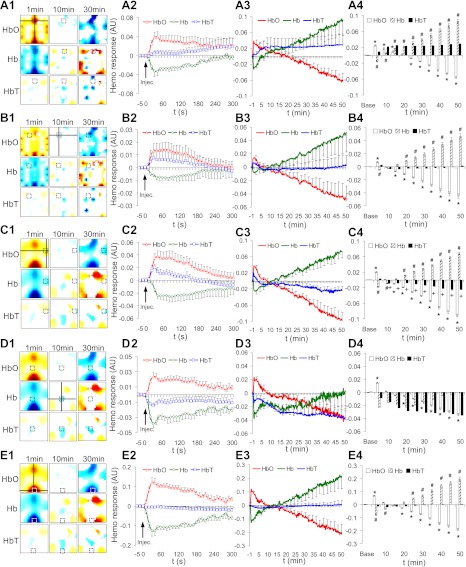
Fig. 3.
Temporal profiles of hemodynamic changes in five ROIs: the anterior midline (A), contralateral (B), ipsilateral (C), central midline (D), and posterior midline (E) areas (ipsilateral: n = 5; all other: n = 6). Dependent variables were hemodynamic changes in average over 3-by-3-pixel ROI in [HbO], [Hb], and [HbT] (shown in first column, A1–E1). See Table 1 for the definition of each ROI. Time courses are plotted within the first 300 s (second column, A2–E2), the full 50 min (third column, A3–E3), and another full 50 min in 5-min bin (fourth column, A4–E4). AU, arbitrary units. Post hoc significant differences (P < 0.05) against baseline are noted: *[HbO], #[Hb], and + [HbT].

