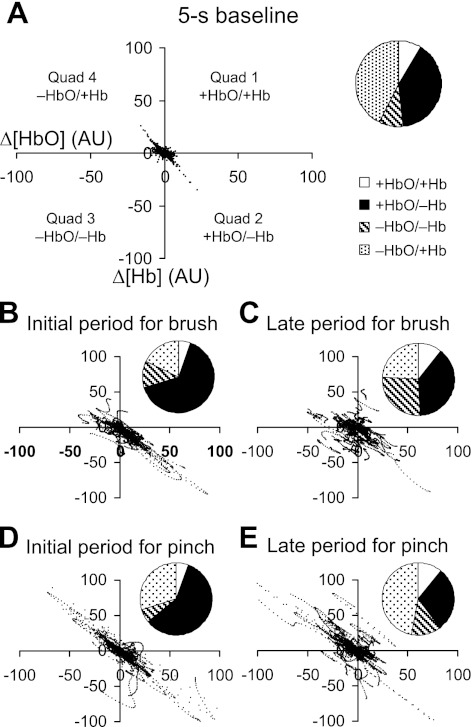
Fig. 8.
Distributions of the HbO and Hb dyads at five functionally distinct time levels. They include a baseline (−5–0.5 s), initial (0–20 s), and late (40–60 s) periods for brush and pinch. Each dyad indicates a pair of simultaneous [HbO] and [Hb] changes from one of nine ROIs. A pie chart demonstrates the percentages of the four kinds of dyads at each time level. Note: Q1, open area; Q2, dark area; Q3, hatched area; Q4, dotted area.

