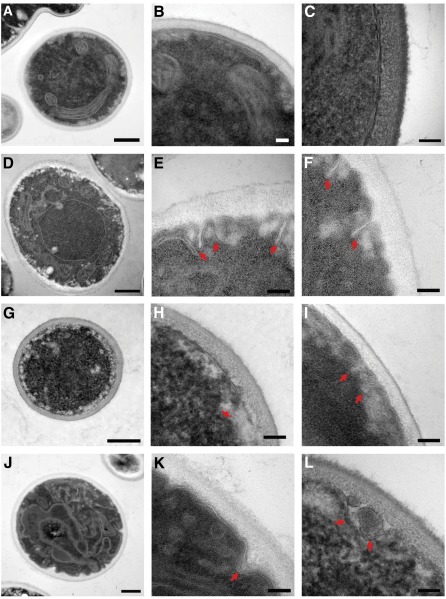
Figure 2.
TEM images of C. glabrata grown at 37°. Calcineurin mutants (cna1 and cnb1) and crz1 mutants display aberrant cell membrane structure (red arrowheads) compared with wild-type. (A–C) wild-type (CBS138). (D–F) cna1 mutant (YC98). (G–I) cnb1 mutant (YC193). (J–L) crz1 mutant (YC182). The cna1 and cnb1 mutants display the most aberrant phenotypes at 37° and could not be recovered from 40° for TEM analysis. Scale bar = 500 nm (A, D, G, J) and 100 nm (B, C, E, F, H, I, K, L). Column one comprises low-magnification images displaying the overall cell structure. Column two displays a second image, at higher magnification, representative of the cell membrane structure of the cell in column one. Column three displays a high-magnification view of the cell membrane of one additional cell.

