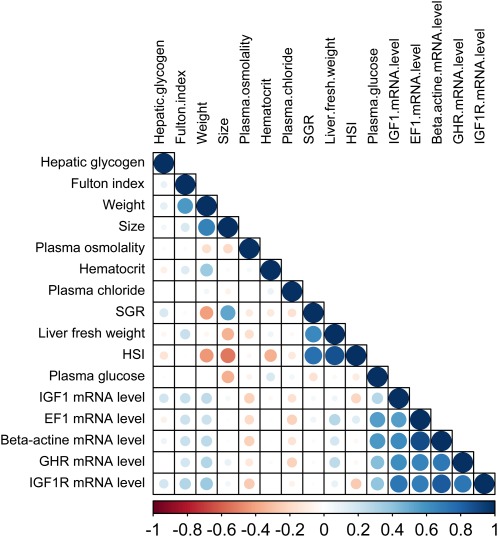
Figure 1.
Correlation matrix displaying the positive (blue) and negative (red) correlations between the phenotypes related to growth measured at T3. Phenotypes have been clustered according to their correlation factor. The graphical representation was given by the R package “Corrplot” (Friendly 2002). SGR, specific growth rate; HSI, hepato-somatic index; igf1, insulin growth factor-1; ef1, elongation factor-1; β-actin, beta -actin; ghr, growth hormone receptor; igf1r, insulin growth factor-1 receptor. Color and size variation of circles in the figure are proportional level and direction (positive or negative) of the correlation between traits.

