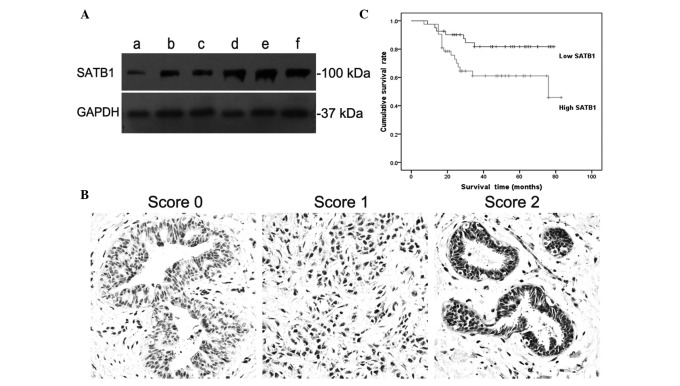
Figure 1.
Western blot assay, immunohistochemical staining and overall survival (OS) curve. (A) Western blotting assay showed SATB1 expression levels in different FIGO stage ovarian cancer cells. FIGO stage I (lane a), II (lanes b and c) and III (lanes d, e and f) exhibited the same positive band at approximately 37 kDa (GAPDH); stage III (lanes d, e and f) showed a strong positive band at approximately 100 kDa (SATB1); stage II (lanes b and c) showed a moderate positive band, but stage I (lane a) showed a weak or negative band. (B) Immunohistochemical staining showed a score 0, score 1 and score 2 staining of SATB1 in ovarian cancer tissues (score explained in Materials and methods). Results were assessed on the basis of intensity and the proportion of positive-staining cells. The positive staining of tumor cells was expressed as yellow-brown particles in the nuclei. (C) Survival curve of 91 patients with ovarian carcinomas shows that a higher expression of SATB1 was associated with lower OS (P<0.05). FIGO, International Federation of Gynecology and Obstetrics.

