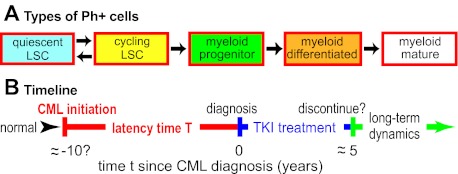
Figure 1.
Cell population dynamic CML models. (A) As an example, one recent model39 considers 5 leukemic cell subpopulations, as shown. For normal (ie, Ph−) cells and for TKI-resistant mutants, similar diagrams are postulated. Arrows indicate possible ways cells can move to a different subpopulation by differentiation or change of cycling status. Parameter calibration requires estimating rate parameters for proliferation, differentiation, and cell death, some of which are affected by TKI treatment such as imatinib dosing. Other current quantitative CML models differ in detail. Some consider many more subpopulations; some do not distinguish between quiescent and cycling LSCs, etc. But most of the models similarly emphasize cell population dynamics and TKI treatment. Some models also consider immune system interactions with CML (supplemental Section 1.6) or some molecular-level events, including CML initiation and/or alterations that may drive CML progression. (B) A “typical” timeline for CML. In this review, CML “initiation“ will refer to the origination of a Ph+ LSC clone sufficiently large that the probability of accidental extinction has become negligible. Current models typically assume that once such a clone has become established, clinically diagnosable CML will result after some, in general patient-dependent, latency time. Parameters relevant to the latency time are often especially problematic since little direct information is available: in humans, CML initiation and early evolution are usually cryptic, although some information about cell population dynamics toward the end of the latency time can be gathered from patients who are diagnosed at atypically early phases of CML.12

