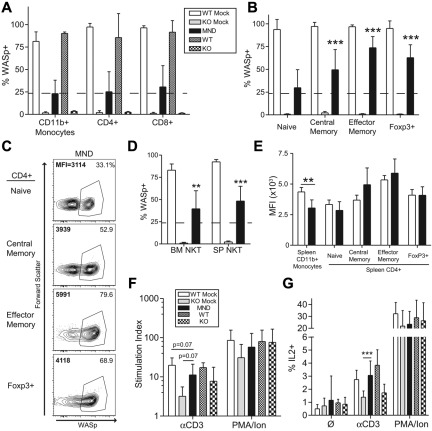
Figure 2.
The MND-WASp LV mediates selection of WASp+ T cells and restoration of T-cell functionality. (A) WASp expression in the splenic CD11b+ monocyte and thymic single-positive T-cell compartment. The dotted line represents WASp expression within splenic monocyte compartment, whereas stars identify significant deviations from monocyte marking. (B) Cumulative data showing the percentage WASp+ cells in distinct CD4+ splenic T-cell subsets. (C) Representative flow cytometry data for CD4+ splenic subsets. The proportion of WASp+ cells is listed in the top right corner, whereas MFI of WASp+ cells is shown in the top left corner. (D) WASp expression in the BM and splenic CD3+NK1.1+ NKT compartment. (E) MFI values were obtained from WASp+ cells. The aggregate MFI values for splenic monocytes and CD4+ T cells are shown. (F) Total splenocytes were stimulated with αCD3 or PMA/Ionomycin and proliferation was quantified using thymidine incorporation. Stimulation index (SI) is the ratio of stimulated compared with unstimulated samples. (G) Total splenocytes were stimulated with αCD3 or PMA/Ionomycin for 6 hours and percent of IL2+CD4+ cells quantified by flow cytometry. With the exception of the MFI data, these findings represent 4 unique experiments with error bars indicative of SD (n = 7 for WTM, 6 for KOM, and 19 for MND). The MFI analysis is derived from 2 unique experiments, n = 4 for WTM mice and 8 for MND animals. Unless specifically indicated, stars indicate significant differences in WASp expression compared with splenic CD11b+ monocytes (*P < .05; **P < .01; ***P < .001).

