
Fig. 2. Differential distribution of synaptic proteins between ventral and dorsal NMJs.
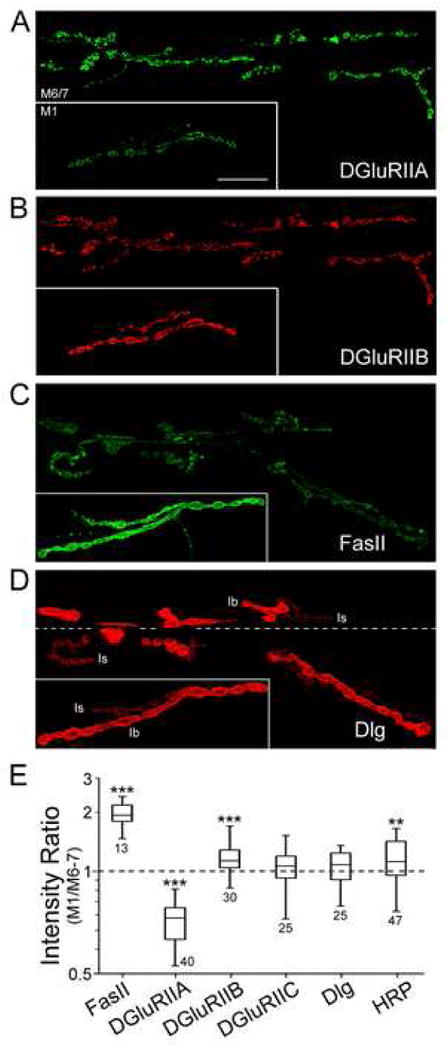
Immunoreactivity against DGluRIIA (A), DGluRIIB (B), FasII (C), and Dlg (D) is shown for ventral (M6/7) and dorsal (M1) NMJs in WT. The approximate boundary between muscles 6 (bottom) and 7 (top) is indicated by a dashed line in (D). Scale bar, 20 μm. (E) D-V differences in the density of receptor and other synaptic proteins. The D/V (M1/M6–7) ratio of pixel intensity is shown with the number of NMJs examined (see Experimental procedures for the measurement). Note opposite trends in the ratios of DGluRIIA vs. FasII, and, to a lesser extent, DGluRIIB. ***, P<0.001, **, P<0.01, *, P<0.05, t-test against the null hypothesis of equal D-V intensity (or the ratio of 1.0).