
Fig. 5. Modified quantal size and quantal content in slo and Sh mutants.
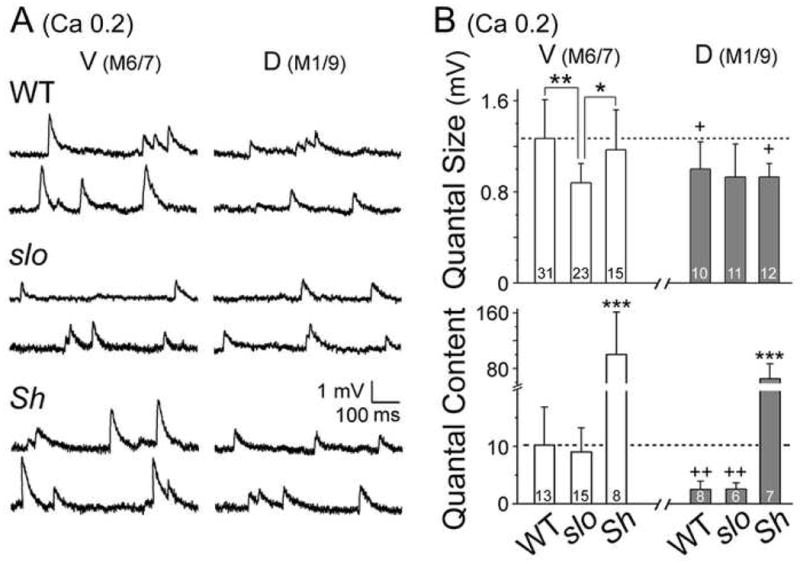
(A) Two sample traces of mEJPs recorded from ventral (M6/7) and dorsal (M1/9) NMJs of each genotype. (B) Pooled data of quantal size (top) and quantal content (bottom) with the number of larvae examined indicated. Note a significant reduction in quantal size at slo ventral NMJs and drastic increase in Sh quantal content. WT data in Fig. 1D are shown as reference. Mean ± SD; ***, P<0.001, **, P<0.01, *, P<0.05, one-way ANOVA among genotypes. +, P<0.05, ++, P<0.01, t-test for ventral vs. dorsal NMJs within a genotype.