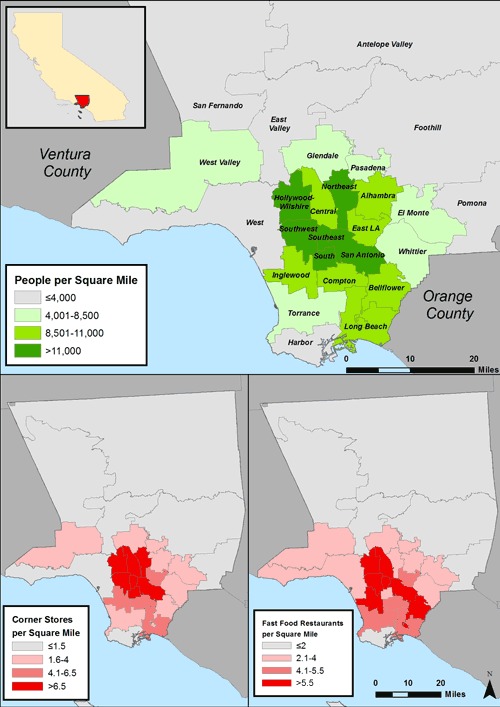
Figure.
Density of population, corner stores, and fast food restaurants in the 26 Los Angeles County health districts. Data on food outlets are from Dun & Bradstreet (26). Population data are from the US Census Bureau (http://factfinder2.census.gov).
| Health District | Population per Square Mile | Corner Stores per Square Mile | Fast Food Restaurants per Square Mile |
|---|---|---|---|
| Compton | 10,484.8 | 5.5 | 4.5 |
| East LA | 8,561.4 | 6.2 | 4.9 |
| East Valley | 2,187.2 | 1.1 | 1.1 |
| El Monte | 6,994.1 | 3.6 | 3.2 |
| Foothill | 631.9 | 0.2 | 0.4 |
| Glendale | 5,630.1 | 2.8 | 3.9 |
| Alhambra | 8,604.3 | 3.3 | 3.9 |
| Harbor | 1,117.6 | 0.5 | 0.5 |
| Hollywood-Wilshire | 14,718.9 | 9.7 | 8.8 |
| Inglewood | 10,701.7 | 5.6 | 5.9 |
| Long Beach | 8,937.0 | 5.0 | 5.2 |
| Northeast | 11,359.2 | 6.6 | 4.0 |
| Antelope Valley | 200.0 | 0.1 | 0.1 |
| Pasadena | 5,634.2 | 2.1 | 3.7 |
| Pomona | 3,988.2 | 1.3 | 2.0 |
| San Antonio | 11,725.0 | 7.0 | 5.8 |
| Bellflower | 8,866.8 | 3.9 | 6.0 |
| San Fernando | 755.2 | 0.3 | 0.5 |
| South | 15,278.1 | 10.8 | 4.0 |
| Southeast | 18,791.7 | 19.0 | 5.6 |
| Southwest | 13,722.0 | 8.5 | 5.8 |
| Torrance | 6,453.6 | 2.9 | 4.8 |
| West | 3,228.9 | 1.4 | 2.1 |
| West Valley | 4,074.9 | 1.7 | 2.7 |
| Central | 10934.8 | 10.2 | 8.2 |
| Whittier | 5,164.3 | 2.3 | 3.0 |

