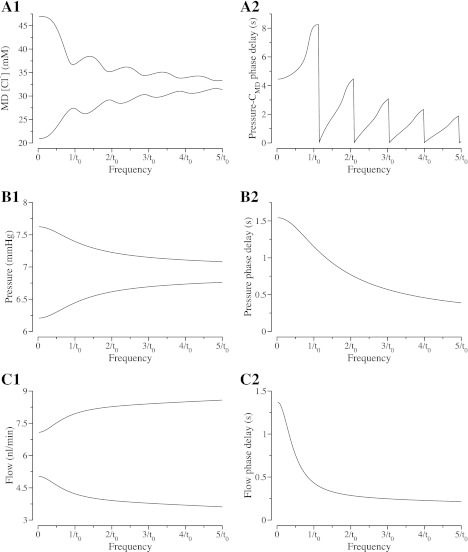
Fig. 6.
TAL frequency base-case response arising from sustained, sinusoidal oscillations in tubular fluid pressure for a range of frequencies. A1: range of tubular fluid [Cl−] at the MD as a function of tubular fluid pressure frequency. Top and bottom bounds of the range reveal a nodal structure in the frequency response. Steady-state TAL transit time, denoted by t0, is 8.83 s; therefore, 1/to = 113 mHz; 2/to = 227 mHz; 3/to = 340 mHz; 4/to = 453 mHz; and 5/to = 566 mHz. A2: phase delay between oscillations in TAL inflow pressure and [Cl−] oscillations alongside the MD. B1: range of tubular fluid pressure alongside the MD as a function of tubular fluid pressure frequency. B2: phase delay between oscillations in pressure at the TAL entrance and alongside the MD. C1: range of tubular fluid flow alongside the MD as a function of tubular fluid pressure frequency. C2: phase delay between tubular fluid flow oscillations at the TAL entrance and alongside the MD.

