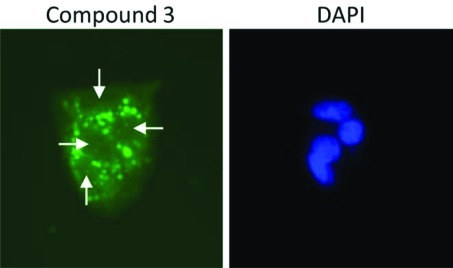
Figure 5.
Subcellular localization of compound 3. HepG2 cells were treated with 50 μM of compound 3 as described in Materials and methods. The compound accumulated in a punctate pattern (shown in green) outside of the nucleus (indicated by white arrows in the left panel and DAPI staining in the right panel).

