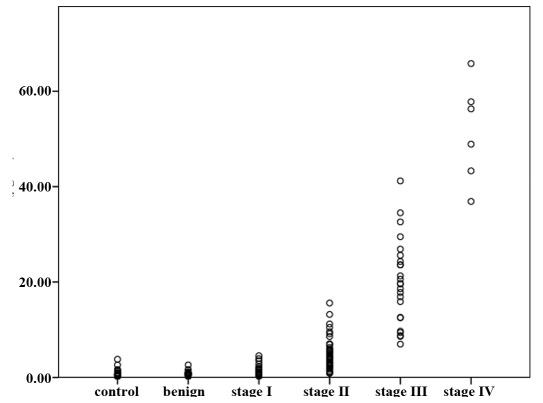
Figure 1.
Concentrations of SAA in controls, benign breast disease and breast cancer patients at various stages of disease are shown. The Kruskal-Wallis test shows significant differences between the groups (p<0.05). Differences between certain groups are indicated by p-values calculated by the Mann-Whitney U-test. Spearman's rank correlation was used to check the correlation between SAA concentrations and the stage of breast cancer. SAA, serum amyloid A.

