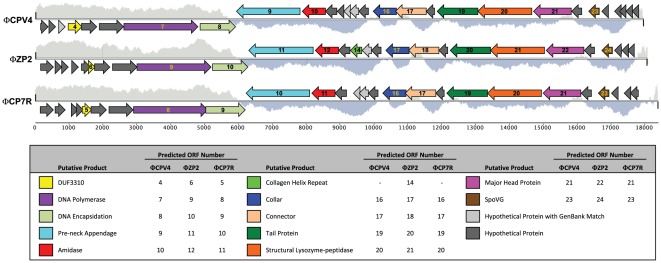
Figure 2. Comparative Genome Maps for Podoviral Bacteriophages Isolated from the Russian Federation and the USA.
The %GC plot displays regions (500-bp window) above and below the average GC content. Open reading frames (ORFs) are depicted as arrows in the predicted direction of transcription and identified putative protein domains are listed in the legend with their respective ORF designation.

