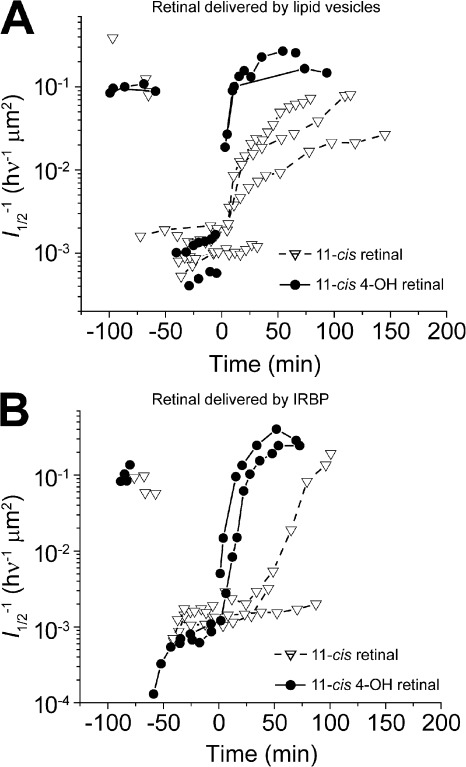
Figure 4.
Effect of different retinoid delivery vehicles on the rate of sensitivity recovery after bleaching. (A and B) Both graphs plot the time course of sensitivity (l1/2) changes in individual rods during darkness before and after a bleach and then after treatment with 10 µM 11-cis-retinal or with 10 µM 11-cis 4-OH retinal. (A) Time course of sensitivity recovery when lipid vesicles are used as the delivery vehicle. (B) Time course of sensitivity recovery when IRBP is used as the delivery vehicle.

