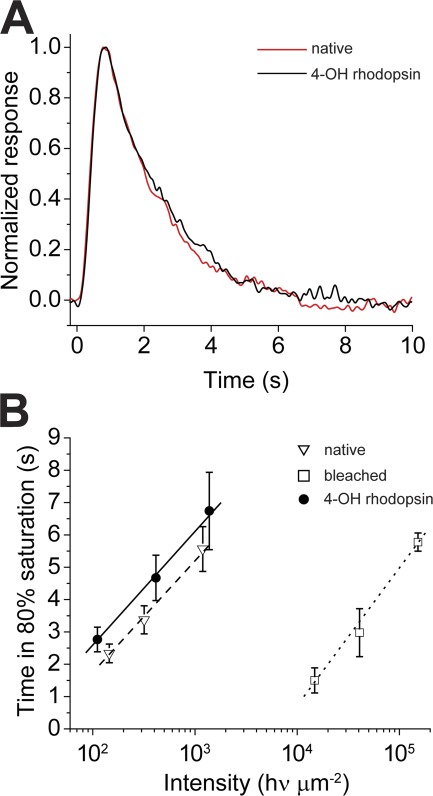
Figure 8.
Flash response kinetics to dim and bright flashes is similar in rods containing 4-OH rhodopsin compared with rods containing native visual pigment. (A) Normalized dim flash responses in dark-adapted native state (n = 8) and when bleached and regenerated with 11-cis 4-OH retinal (n = 8). There is no significant difference in the time course of the responses. The responses have been smoothed by adjacent averaging. (B) Plots of the time necessary for responses to bright saturating flash responses to recover to 80% of saturation amplitude. Measurements made in a background of darkness when outer segments contained native visual pigment (dashed line; n = 9), after 99.9% bleached (dotted line; n = 9), and after regeneration with 11-cis 4-OH retinal (solid line; n = 9). The retinal concentration was 10 µM in 0.1% ethanolic solution. Data points in B are plotted ± SEM.

