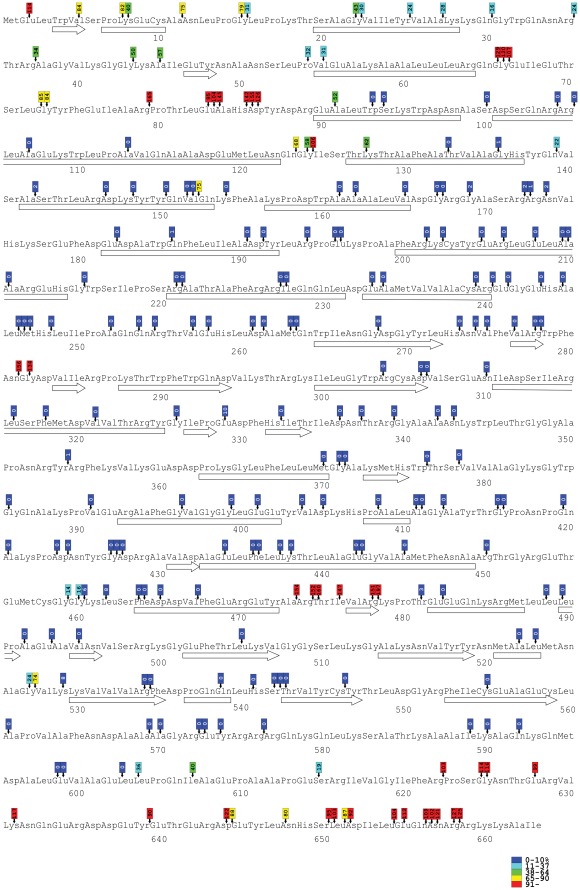
Figure 4. Location of insertions within the amino acid sequence and relative transposition activity of each mutant.
Amino acid positions are numbered under the sequence. Secondary structures (determined with DSSP, [74]) are indicated under the corresponding sequence as bars (α-helices) or arrows (β-strands). Small vertical arrows point to the exact location of each insertion (in each three-letter amino acid code, the first letter represents the first nucleotide of the corresponding codon, etc.), and the attached coloured boxes indicate ranges of transposition activity of each mutant relative to the wild type activity (colors denoting the percentage ranges are shown at the lower-right). The number within the boxes indicate the observed relative activity.

