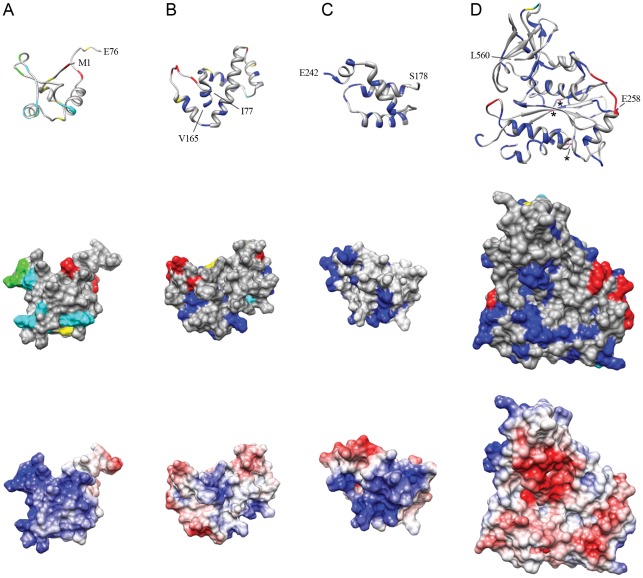
Figure 5. Insertion sites and corresponding transposition activities displayed in the context of the known domain structures of MuA.
Shown are ribbon and surface models with the insertion mutant data as well as the electrostatic potential of the wild type protein. (A) Subdomain Iα (aa 1−76, PDB accession code 1TNS). (B) Subdomain Iβ (aa 77−168, 2EZK). (C) Subdomain Iγ (aa 178−242, 2EZH). (D) Domain II (aa 258−560, 1BCO). The first and last residues resolved in the structures are labeled with a corresponding number. The amino acid residues corresponding to each insertion site are coloured according to the MuA activity chart and data defined in Figure 4. The stars in panel D ribbon model highlight the DDE-motif residues shown in magenta within the protein chain.

