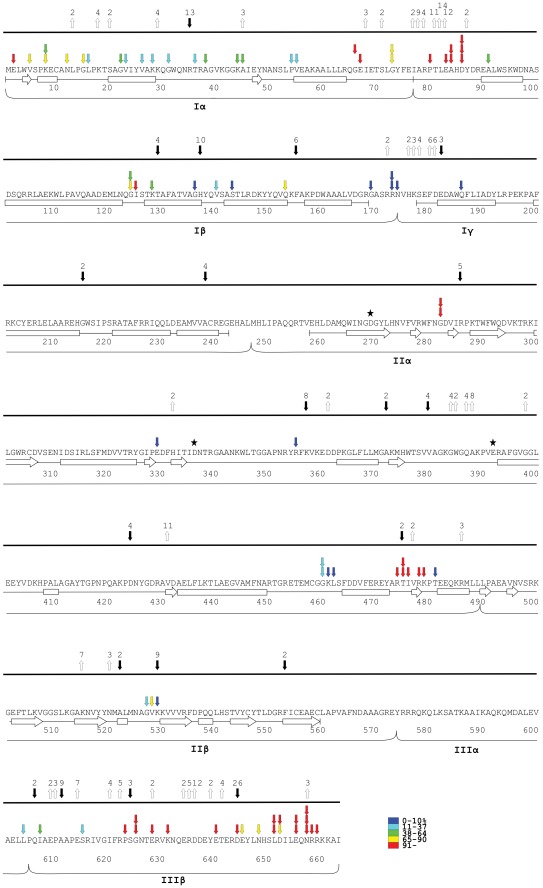
Figure 6. Identification of insertion-tolerant regions in MuA on the basis of pentapeptide insertion analysis and alignment-based data.
Above the amino acid sequence are shown with arrows the pentapeptide-insertion tolerant sites (activity level ≥1%) colour-coded as in Figure 4. The percentage range chart is shown at the lower-right. Two or three arrows per site are indicative of insertions involving more than one reading frame. Below the amino acid sequence are shown the secondary structural elements (arrows and rectangles). The elements are connected with line segments indicating the length of each PDB structure. Below the structural elements are shown the subdomains as specified in Figure 3. Above the bolded line, the downward black and upward white arrows represent the alignment-based insertion and deletion (indel) data, respectively (each particular indel precedes the marked amino acid). The maximum indel length at each site is indicated by a number shown above each arrow (data from Figure S1). The stars indicate the DDE-motif residues (D269, D336, E392).

