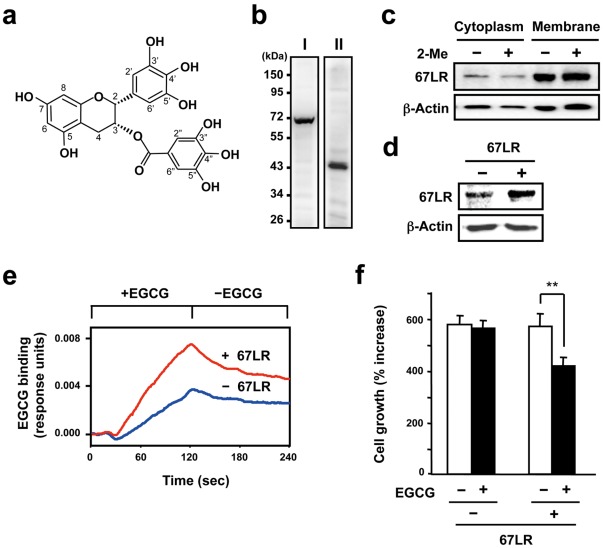
Figure 1. The relationship between the responsiveness of EGCG to the HepG2 cells and 67LR expression.
A) Chemical structure of green tea polyphenol EGCG. B) Western blot analysis of whole cell lysate from HepG2 cells using anti-LR antiserum (I) and anti-LR antibody F-18 (II). C) To examine the expression of 67LR on cell membrane in HepG2 cells, both cytosolic and membrane fractions were prepared, and the 67LR were detected by western blot analysis using anti-LR antiserum. This test was performed under reducing (2-Me (+)) or non-reducing (2-Me (−)) conditions. 2-Me indicates 2-mercaptoethanol. The lower panel displays protein levels from the same filter blotted again with the anti-β-actin antibody used as a quantitative loading control. D) The cells transfected with either the empty vector (−) or the 67LR gene expression vector (+) were lysed and total cellular protein was subjected to western blot analysis using the cell-surface LR-specific antibody MLuC5. The lower panel displays protein levels from the same filter blotted again with the anti-β-actin antibody used as a quantitative loading control. E) Both transfected cells were fixed on the sensor chip. The cell-surface binding of EGCG to immobilized 67LR-overexpressed or control HepG2 cells were measured using a surface plasmon resonance (SPR) biosensor. EGCG was injected at a concentration of 10 µM for the time indicated interval in the figure. F) Both types of cells were treated with 1 µM EGCG for 5 days. The results are shown as the relative cell number to untreated control and the data presented are means ± S.D. (n = 3) (Student’s t-test, **, p<0.01).

