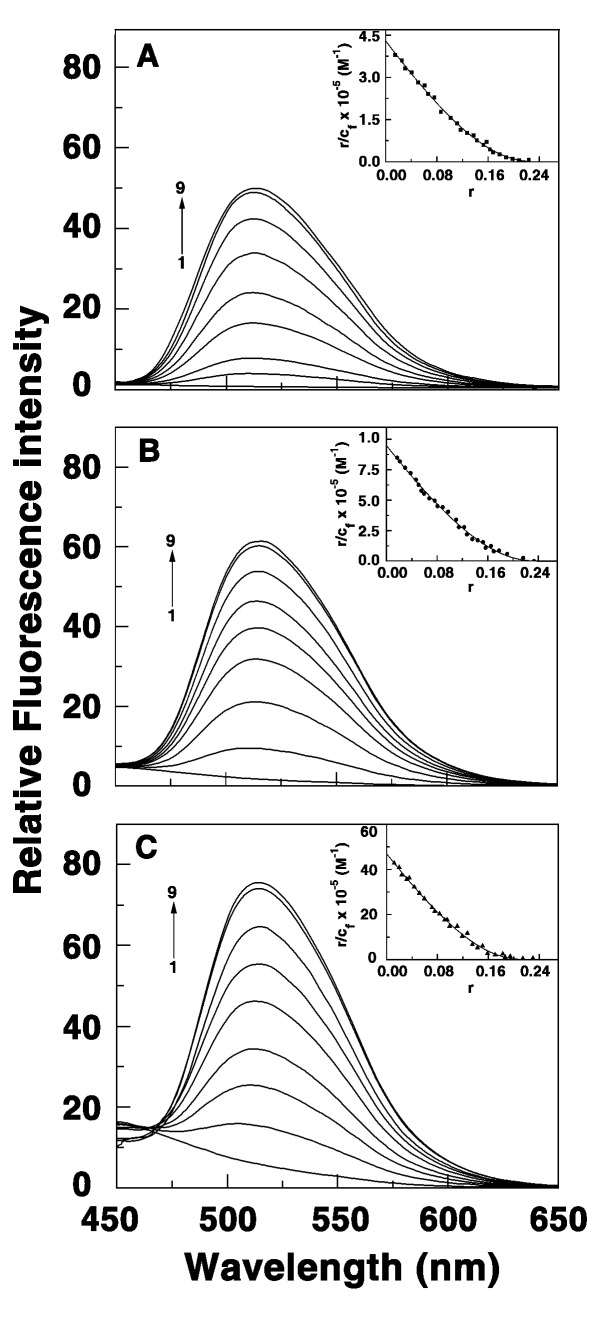
Figure 3. Fluorescence spectra of BC and BC analogs in presence of triplex.
(A) BC (B) BC1 (C) BC2 (2.0 μM each) treated with increasing concentration of RNA triplex. P/D saturation for BC, BC1 and BC2 were 32.0, 24.0 and 18.0, respectively. Inset: respective non-cooperative Scatchard plots of binding.

