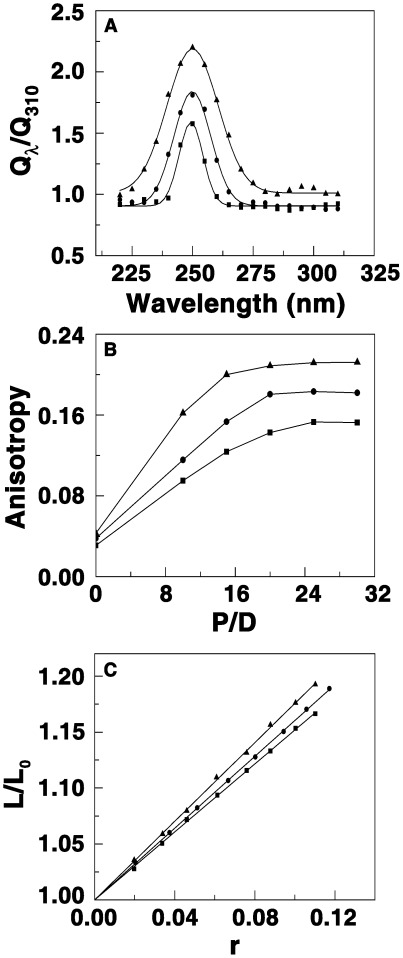
Figure 5. Variation of the relative fluorescence quantum yields, anisotropy and visocisty.
(A) Variation of the relative fluorescence quantum yield of BC (▪), BC1 (•), and BC2 (▴) in the presence of poly(U)• .poly(A)*poly(U) as a function of excitation wavelength. (B) A plot of the variation of anisotropy values versus P/D ratio for the complexation of BC (▪), BC1 (•), BC2 (▴) with poly(U)•poly(A)*poly(U). (C) A plot of increase in helix contour length (L/Lo) versus r for the complexation of BC (▪), BC1 (•), BC2 (▴) with poly(U)•poly(A)*poly(U) at 25±0.5°C.

