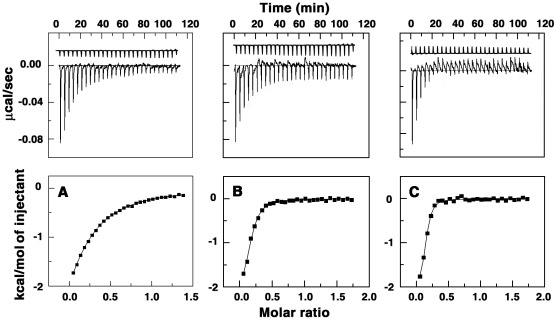
Figure 7. Representative isothermal titration calorimetry profiles for the titration of BC and analogs to triplex.
Titration profiles are shown for poly(U)•poly(A)*poly(U) with (A) BC (B) BC1 and (C) BC2 at 25°C. The top panels represent raw data for the sequential injection of the alkaloid into the triplex solution. The lower panels represent the corresponding normalized heat signals versus molar ratio. The data points (▪) reflect the experimental injection heat while the solid lines represent the calculated fit of the data.

