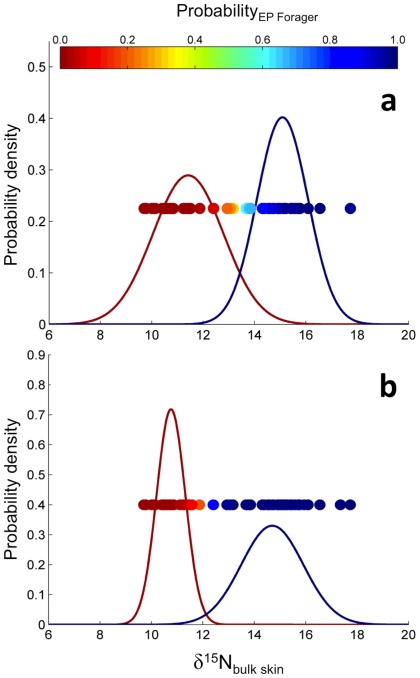
Figure 5. Marginal posterior distributions of δ15N values for the two assumed foraging grounds (bell-shaped curves) and individual assignments to one of the two foraging grounds (filled circles in horizontal arrangement) with color-coded probabilities of belonging to the eastern Pacific foraging area.
Panel A is from Model 4, whereas the Panel B is from Model 6. For both models, posterior distributions depicted in red are from the ‘low δ15N’ (i.e. putative western Pacific foragers), whereas those in blue represent the ‘high δ15N’ group (i.e., putative eastern Pacific foragers).

