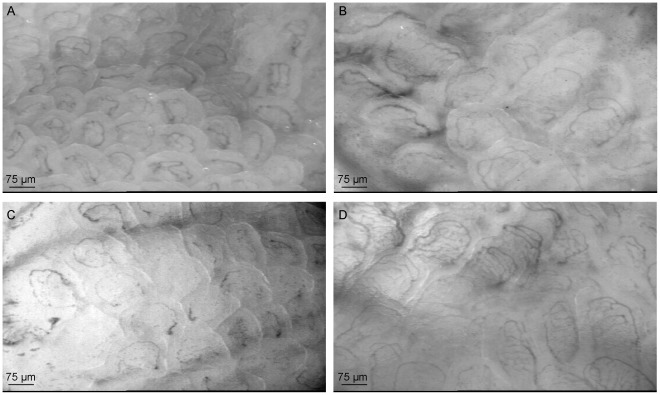
Figure 3. Representative live images of the microcirculatory measurements in jejunal villi with SDF imaging.
(A) Representative live image of the jejunal microcirculation in a control mouse. (B) Representative live image of the jejunal microcirculation in a LPS-Ala treated mouse which shows only perfusion of the larger vessels. (C) Representative live image of a LPS-Arg treated mouse which shows a comparable perfusion pattern as the LPS-Ala treated mouse. (D) Representative live image of a LPS-Cit treated mouse, which’s shows more small perfused vessels per villus.

