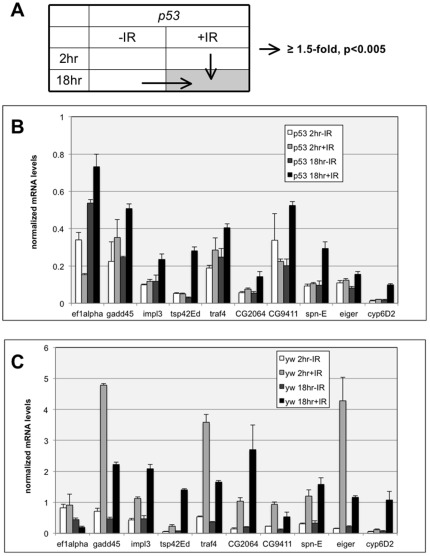
Figure 1. Validation by quantitative RT-PCR of 10 candidate genes identified in microarray analysis.
Total RNA was isolated from wing imaginal discs of third instar larvae at 2 or 18 hr after exposure to 0 or 4000R of X-rays. RNA was reverse-transcribed into cDNA and subjected for quantitative RT-PCR analysis as described in Methods. a-tubulin levels were used to normalize the graphs. Error bar = 1 STD. (A) A schematic representation of data comparisons used to select candidates for validation. The gray box denotes the time at which apoptosis becomes detectable in p53 mutants. (B) Q-RT-PCR results in p53 mutant wing imaginal discs (B) Q-RT-PCR results in wild type (yw) wing imaginal discs.

