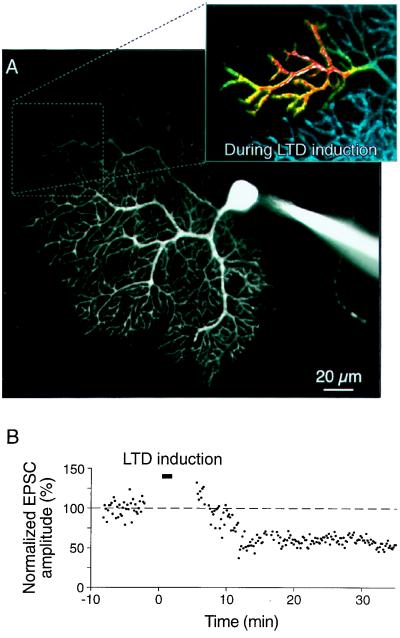
Figure 3.
Confocal fluorescence imaging of neuronal Ca2+ signals during induction of LTD. (A) Cerebellar Purkinje neuron in a brain slice preparation. The cell was loaded with the fluorescent sensor Calcium Green-1 via a patch electrode (shown on the right). The electrical responses as well as [Ca2+]i was monitored while afferent inputs were activated. Inset shows the localized Ca2+ transient that occurred during induction of LTD at these inputs. (B) Time course of LTD induction. The peak amplitudes of the electrical responses (EPSCs) were normalized to the mean baseline values. The horizontal bar indicates the induction period. Modified from ref. 10.

