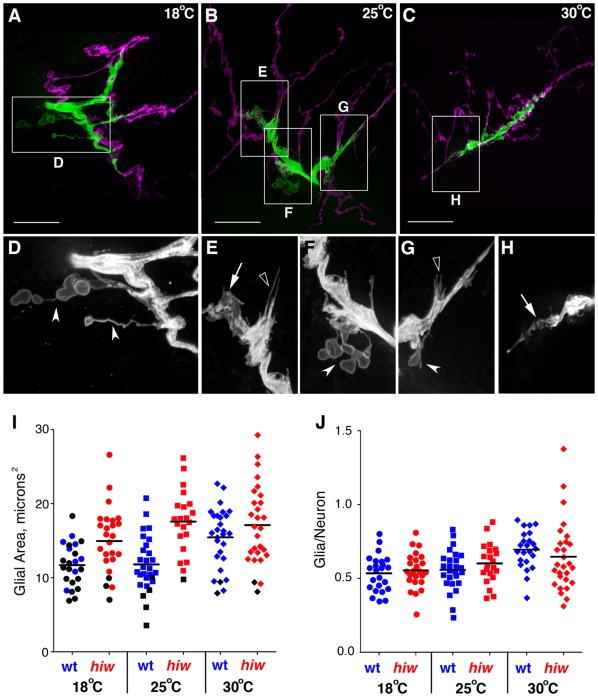
Figure 8. Glial processes were expanded in the highwire mutation.
A–C) Live NMJs from F3 larvae with glial processes labeled with repo>CD8GFP (green) and boutons immunolabeled with α-HRP (magenta). NMJs are shown from hiw larvae raised at 18°C (A), 25°C (B) and 30°C (C). Glial areas: A = 26.7 µm2; B = 26.2 µm2; C = 16.7 µm2. Scale bars, 15 µm. D–H) Grayscale images showing details of the glial processes from the corresponding boxed regions in A–C. Panels were digitally scaled 200%. Glial processes extended away from the NMJ across the muscle surface (arrowheads) or tracked along the center of the bouton area (arrows). Filopodial-like processes were also frequently observed (open arrowheads). I–J) Statistical comparison of the glial process areas from F3 hiw larvae (hiw; red) compared to wild-type (wt; blue) larvae raised at 18°C (circles), 25°C (squares) or 30°C (diamonds). I) The mean area of glial processes was significantly larger in hiw mutants than wild-type at 18°C and 25°C (P<0.0001) but not 30°C. Black symbols represent those NMJs with glial processes that stopped at the motor axon end. J) The mean ratio of the GP area to neuronal (α-HRP) area was not significantly different between hiw and wild-type larvae at any rearing temperature.

