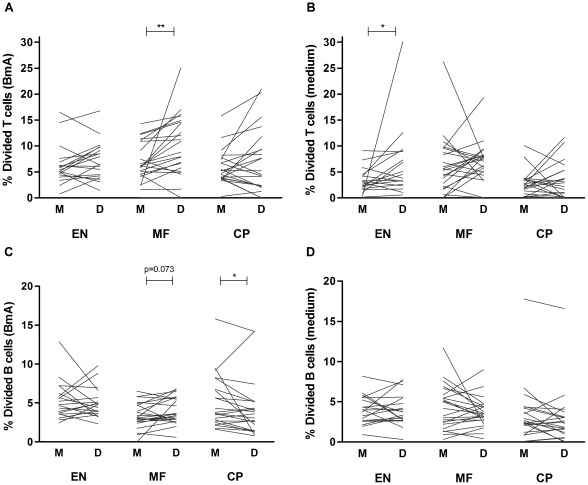
Figure 4. Suppressed lymphocyte proliferation is restored after Treg depletion in microfilaremics.
Divided cell populations were assessed in mock- (M) and Treg-depleted (D) PBMC from EN, MF and CP subjects. CFSE dilution was analyzed for CD4+CD25+ T cells (A–B) and CD19+ B cells (C–D). Cultures were stimulated with BmA (left panel; A&C) or left unstimulated (cultured with medium) (right panel; B&D). Plotted lines represent data points from single individuals; tested by Wilcoxon signed rank test, *p≤.05 **p≤.01, p-values between 0.05 and 0.10 are indicated.

