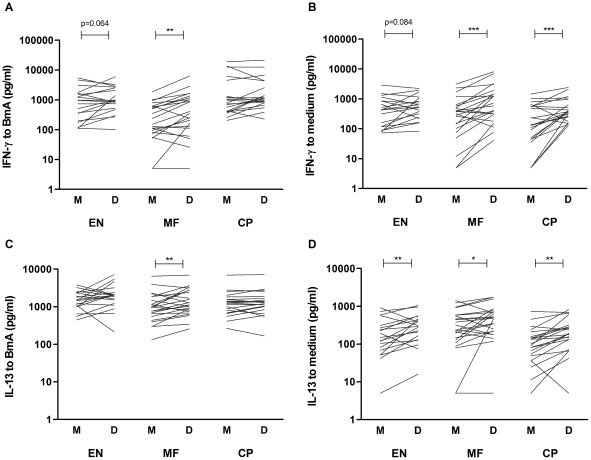
Figure 5. Removal of Tregs enhances filaria-specific Th1 and Th2 responses.
Cytokine secretion was assessed in mock- (M) and Treg-depleted (D) PBMC cultures from EN, MF and CP individuals. IFN-γ (A–B) and IL-13 (C–D) secretion is depicted for BmA- (left panel) and unstimulated (right panel) conditions. Connecting lines represent data points of one individual, for mock- and Treg-depleted cultures; tested by paired t-test *p≤.05 **p≤.01***p≤.001, p-values between 0.05 and 0.10 are indicated.

