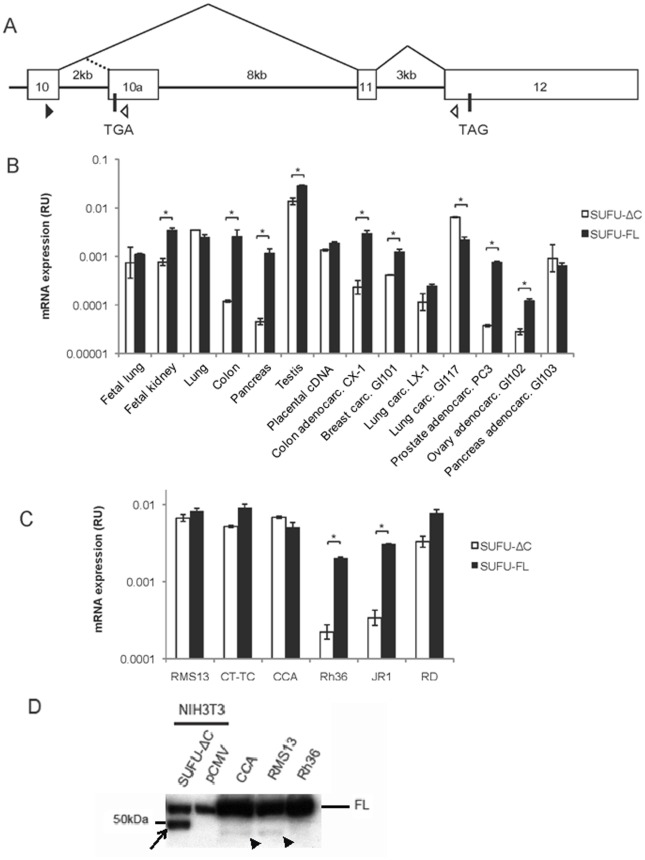
Figure 1. Expression of SUFU-FL and SUFU-ΔC in human tissues and cell lines.
A, Schematic map of the SUFU exon 10 to exon 12 genomic region. Exons are shown by open boxes and splicing events by thin lines. The translation termination codons TGA and TAG are indicated, while the black and white triangles show the position of the PCR primers used. B, Real-time PCR analysis of SUFU-FL and SUFU-ΔC expression in a multiple tissue/tumor cDNA panel. C, Real-time RT-PCR analysis of SUFU-FL and SUFU-ΔC expression in the E-RMS cell lines JR-1, RD, Rh36, CCA, CT-TC and the A-RMS cell line RMS13. For both the B and C panels the data are presented as relative unit (RU) expression values, after normalization to the housekeeping gene large ribosomal protein (RPLPO), which is given the value of 1. Error bars indicate the standard deviation. *, Statistical significant difference, p<0,01, (Student’s t test). D, Western blot analysis of extracts from NIH3T3, transfected with an expression construct for SUFU-ΔC-FLAG, or pCMV (vector), CCA, RMS13 and Rh36 cells, and detected with a SUFU antibody. Note that CCA and RMS13 but not Rh36 cells express a protein band (arrowheads), which co-migrates with that of the transfected SUFU-ΔC FLAG-tagged construct (arrow), the small size difference apparently reflecting the presence of a FLAG tag. The endogenous SUFU-FL protein is indicated by FL.

