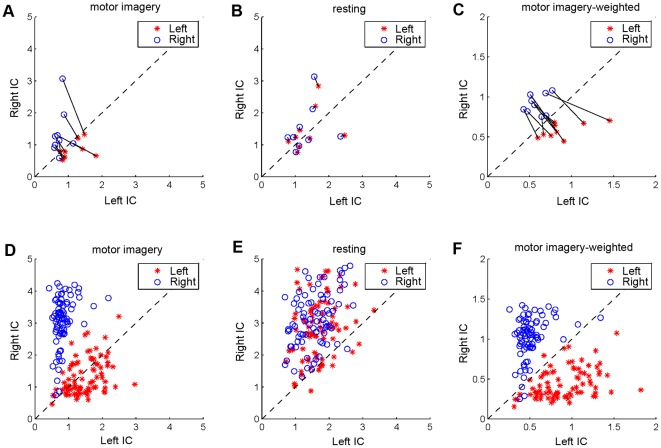
Figure 8. EEG power of motor ICs during resting and motor imagery states.
(A) EEG power of motor ICs during motor imagery; (B) EEG power of motor ICs during resting; (C) Weighted EEG power of motor ICs during motor imagery (original power divided by the mean power of the resting data). (D) Single-trial EEG power of motor ICs during motor imagery on one subject. (E) Single-trial EEG baseline power of motor ICs during resting. (F) Weighted single-trial EEG power of motor ICs during motor imagery. In (A), (B), and (C), each solid line connects left hand and right hand data for a subject. The dash line indicates the line  .
.

