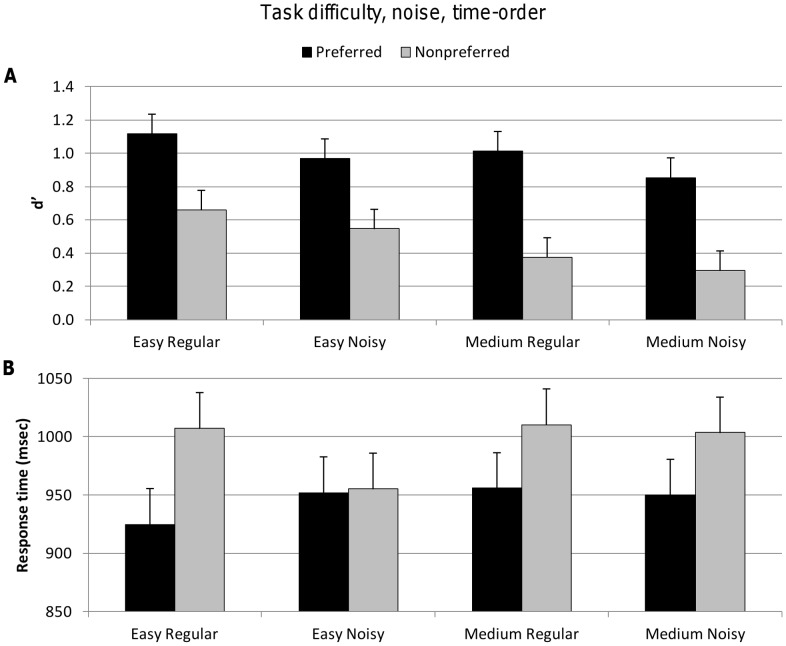
Figure 3. Accuracy (d′) and response time for explicit factors task difficulty, noise and implicit factor time-order.
Vertical bars represent within-subject SEM. A. Top figure shows d′ values significantly decreased for the nonpreferred time-order trials, as it did for the explicit factors of task difficulty and noise. B. Lower figure shows significantly longer response times for nonpreferred time-order trials. There were no significant differences in response time across task difficulty and noise levels.

