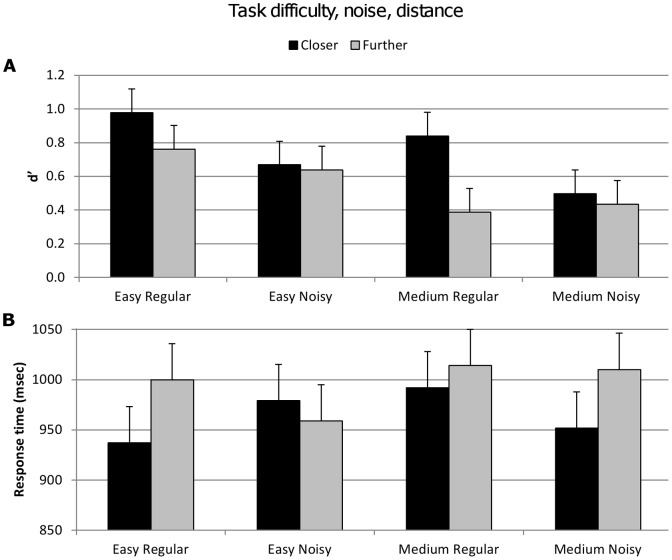
Figure 6. Accuracy (d′) and response time for factors task difficulty, noise and implicit factor distance.
Vertical bars represent within-subject SEM. A. Top figure shows d′ values significantly decreased for with increasing task difficulty, presence of noise, and for the further distance trials. There was an interaction between noise and distance. B. Lower figure shows there were no significant main effects for response time.

