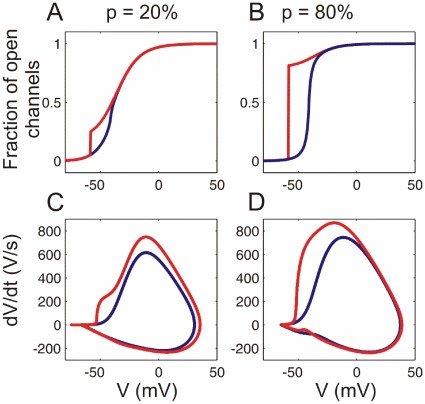
Figure 3. Channel activation and AP dynamics in models with cooperative sodium channels.
(A,B) Activation curves of sodium channels and (C.D) AP phase plots for the models with a small ( ) and a large (
 ) fraction of cooperative channels, and a weak coupling (
 , blue traces) or strong coupling (
 , red traces).

