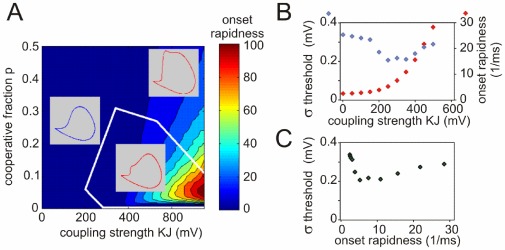
Figure 4. AP onset rapidness and threshold variability in models with cooperative channels.
(A) Dependence of the AP onset rapidness measured as the phase slope at  on the coupling strength and the fraction of cooperative channels. White contours delimit the bounder lines between the monophasic and the biphasic APs (see insets). (B) Dependence of the threshold variability (blue symbols, scale on the left) and onset rapidness (red symbols, scale on the right) on the coupling strength
  for a model with a small fraction (
 ) of cooperative channels. Fluctuating current for injection that mimicked background synaptic noise was synthesized as described in Methods (see Eq. 3) (C) Relation between threshold variability and AP onset rapidness for the same model, data from (B).

