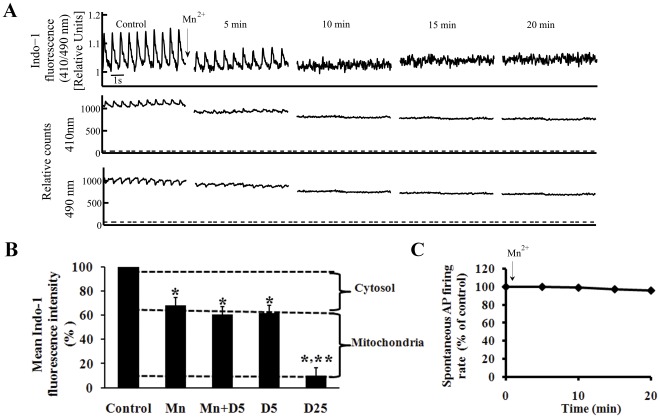
Figure 1. Validation of mitochondrial Ca2+ measurements.
(A) Mn2+ (50 µmol/L) quenching of the cytosolic Indo-1 fluorescence ratio 410/490 (top panel), and fluorescence emission at wavelengths of 410 (middle panel), and 490 nm (lower panel). Dashed line under recordings of flourecence emission at individual wavelengths indicates background cell autofluorescence (the fluorescence without Indo-1 loading). (B) Permeabiliziation of the sarcolemma by 5 µmol/L digitonin alone (D5; n = 6) or together with Mn2+ to quench cytosolic Indo-1 (n = 6). Note that Mn2+ plus digitonin decreases the Indo fluorescence to the same level as Mn2+ alone (n = 10). A higher digitonin concentration (25 µmol/L D25; n = 4), permeabilizes the mitochondrial membrane in addition to the sarcolemma, and markedly depletes the cell fluorescence. (C) Application of Mn2+ does not alter the spontaneous AP firing rate. *p<0.05 vs. drug control, **p<0.05 vs. Mn2+.

