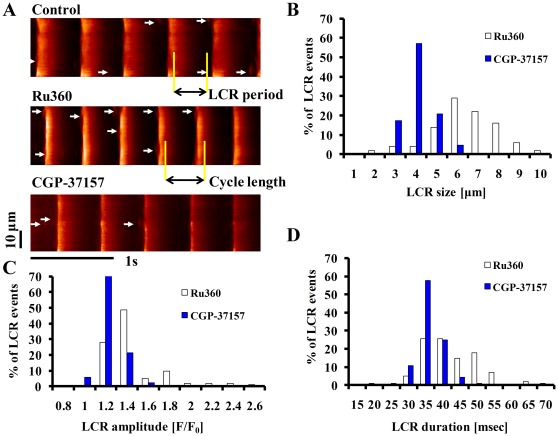
Figure 4. Specific inhibition of Ca influx into or efflux from mitochondria in intact SANC modifies spatiotemporal characteristics of LCRs.
(A) Confocal line scan Ca2+ images of a representative SANC before and following exposure to 2 µmol/L Ru360 or 1 µmol/L CGP-37157. LCRs are indicated by arrowheads. The LCR period is defined as the time from the peak of the prior AP-induced Ca2+ transient to the LCR onset. Histograms of LCR (B) size (full width at half-maximum amplitude), (C) amplitude (F/F0), and (D) duration (full duration at half-maximum amplitude) in the presence of Ru360 (n = 12; 102 LCRs) and CGP-37157 (n = 12; 92 LCRs).

