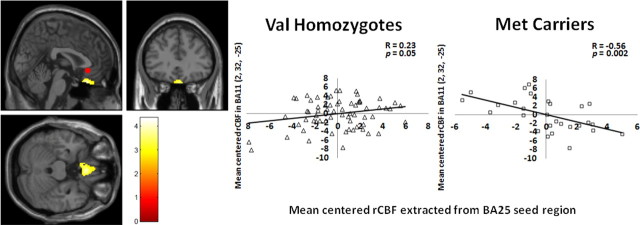
Figure 4.
BDNF allelic variation affects rCBF functional connectivity. Statistical parametric map and graphs showing differential functional connectivity between genotype groups. Between-group difference in functional connectivity between the BA25 seed region (red circle) and BA11; between-group difference in the slopes of the correlations was significant at the p = 0.0001 level. Post hoc analysis of extracted rCBF values (at MNI coordinates x, y, z = 2, 26, −24) demonstrated a positive correlation for the Val homozygotes (r = 0.23, p = 0.05) and a negative correlation for the Met carriers (r = −0.56, p = 0.002).

