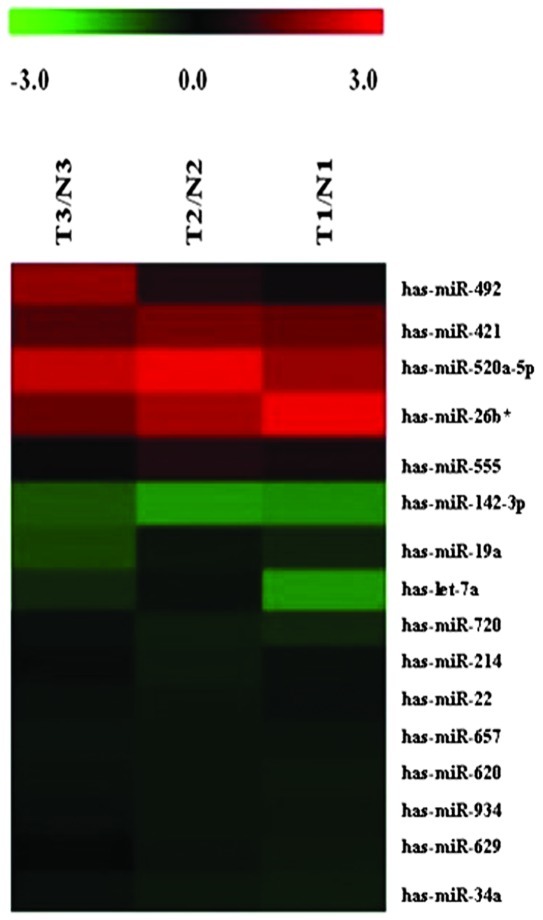
Figure 1.
miRNAs differentially expressed in mature ovarian teratomas versus normal tissues. The rows show individual genes, while the columns show individual tissue samples. Red denotes a high expression and green denotes a low expression. T1-T3, tumor tissues; N1-N3, normal tissues; miRNA, microRNA.

