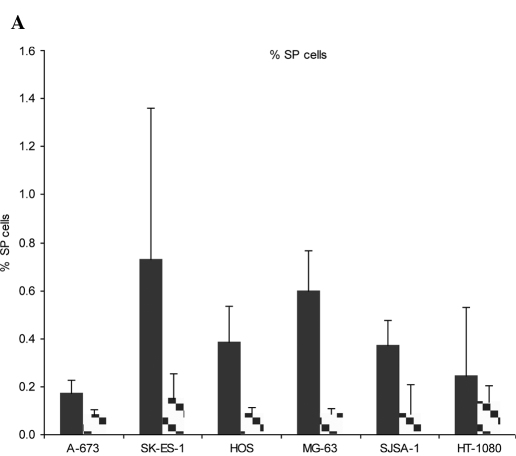
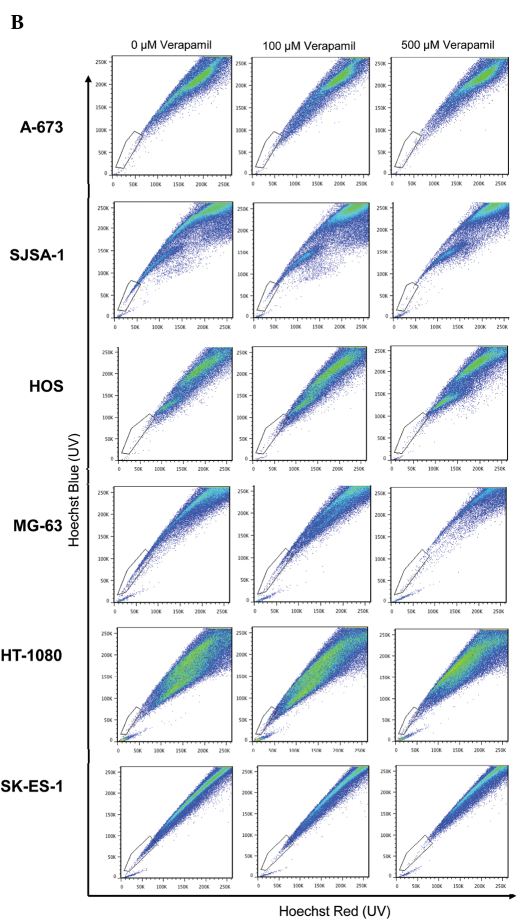
Figure 2.
Percentage of SP cells. (A) Cells were exposed to Hoechst 33342 for 2 h in the absence of verapamil (solid black bar) or in the presence of 500 μM verapamil (checked bar). SP was determined through red and blue Hoechst fluorescence. (B) Representative staining. Combination of three independent experiments is depicted. Error bars: standard error of the mean.


