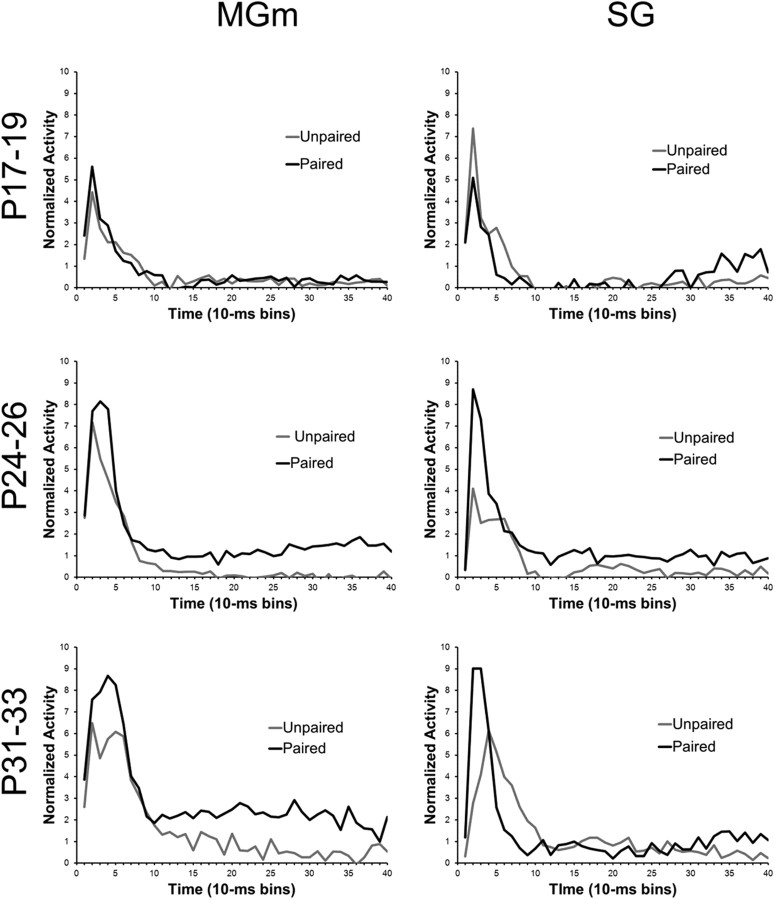
Figure 12.
Plots of the average normalized activity from the population of neurons responsive to the 400 ms tone CS during the unpaired pretraining session (Unpaired, gray line) and the last paired training session (Paired, black line) in the MGm and SG nucleus from rat pups trained on P17–P19 (top row), P24–P26 (middle row), or P31–P33 (bottom row).

