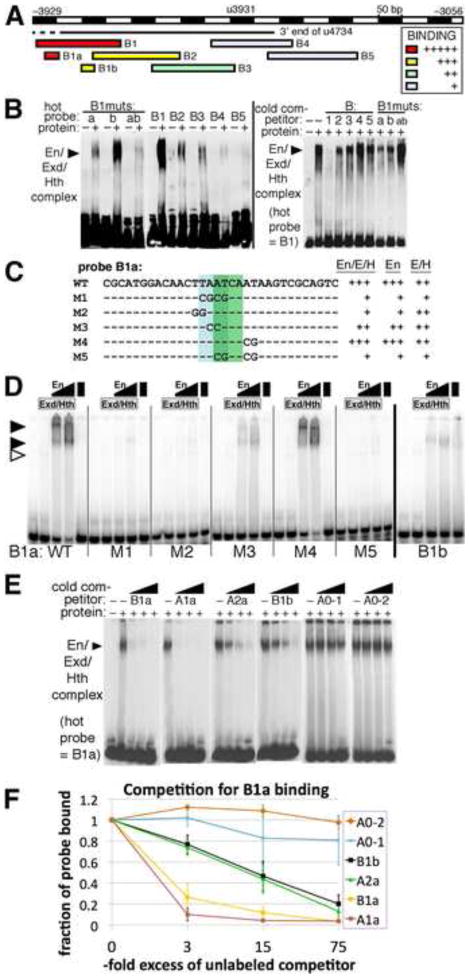
Fig. 6. Cooperative binding by Engrailed. Extradenticle and Homothorax to En-responsive region B within CRM u4734.
A: summary of in vitro binding to probes from region B by En+Exd+Hth. Relative strength of binding in EMSAs is indicated by colors, listed in the inset. Examples are shown in B.
B: Left panel: binding to large labeled (“hot”) probes in region B by En+Exd+Hth (lanes labeled with “+”). The labeled probes used are indicated across the top: under B1muts, “a” has the M1 mutation within B1a (shown in C), “b” has a mutation within B1b that destroys cooperative binding (data not shown), and “ab” has both. The position of the main cooperative complex is indicated by a filled arrowhead. Right panel: competition for binding to B1 by BIBS and by mutant versions of B1, as indicated across the top. Note that B1 competes very effectively, while other oligonucleotides are less effective. Under B1muts, B1 carrying mutations “a”, “b”, or both (“ab”) was used as unlabeled (“cold”) competitor.
C: summary of in vitro binding to probe B1a and mutated versions. Indicated to the right of each probe sequence is the observed strength of complex formation by En+Exd+Hth (“En/E/H”), En alone, or Exd+Hth (“E/H”) relative to that for B1a (“WT”) as determined by EMSAs, some of which are shown in D.
D: binding to probe B1a and mutant versions (indicated at the bottom), and to B1b, by Exd+Hth, En and a combination of all 3, at 2 different concentrations of En (as indicated at the top, see Materials and Methods). The positions of cooperative complexes formed with all 3 proteins are indicated by filled arrowheads, and the position of the Exd+Hth complex by an open arrowhead. Note that binding to B1a by all 3 proteins is cooperative, that there is virtually no cooperative complex with either mutant M1, M2, or M5, and that binding to B1b appears weaker and less cooperative than binding to B1a.
E: competition for binding by En+Exd+Hth to B1a by unlabeled oligonucleotides representing the sites listed across the top, at about 3, 15, and 75-fold molar excess over probe (B1a) from left to right in each case. Oligo sequences used were: B1a: CGCATGGACAACTTAATCAATAAGTCGCAGTC, A1a: GCAAACAACTAATTAAGTCATCAGGATGAAAG, A2a: ATGAGGTTCAAAATGAGCCATCACCCATTGAC, B2a: GGTGTGGAACTGATCAATTATAGTGGGTGTTG, A0-1: ACACTTGAAAAATATTCATCAGTGAATAAGac, A0-2: tTCTTTTTCCGTTGACCATCAGCTGCTGTCCa. Note that both A1a and B1a compete very well, while A2a and B1b compete somewhat well, and A0-1 and A0-2 compete relatively poorly.
F: Quantitation of competition binding assays. Three trials of the competition assays shown in E were quantified using densitometry and Image J software. The averages and standard deviations of the fraction of probe bound at each concentration of competitor are plotted, for the oligonucleotides listed in the inset. Note that A1a competes best, indicating that it has the highest affinity for the combination of En+Exd+Hth at the concentrations used, B1a competes only slightly less well, while A2a and B1b each show an ability to compete that indicates an intermediate affinity, and A0-1 and A0-2 show little ability to compete at these concentrations.

